Introduction
Magic: The Gathering (MTG) is a collectible card game released in 1993 and improved and expanded ever since by Wizards of the Coast (WotC, a subsidiary of Hasbro since late 1999). The game is notable for its complexity and design, a recent paper demonstrates that optimal play is at least as hard as the halting problem and can be made Turing complete with a certain set of cards. Throughout this article there is some expectation of knowledge of MTG, an explanation of gameplay would be too long here and would certainly miss details. I encourage a reader unfamiliar with MTG to watch this video about gameplay from WotC.
What should be understood is that the game is complex and it is important which cards to play. The strength of a card can be evaluated by their abilities and attributes. By “strength,” it does not necessarily mean damage it can inflict so much as it means playability and how much of an advantage it gives the player. Through card abilities and attributes, some cards are stronger than others, this difference in strength is encoded in each card’s rarity. Rarity is one of “common”, “uncommon”, “rare”, or “mythic rare.” There are rubrics to how card rarity is determined (see next section) though it is not precise. An intermediate player should be able to accurately guess rarity with a card’s description and mana cost.
The aim of this article is to explore and answer if a machine learning (ML) model can predict card rarity from its attributes. The purpose of the answer is to discover cards that are potentially misclassified and then exploit this misclassification for deck building. The main attributes of a card that will be focused on are card type, mana cost, and card ability.
How rarity is determined by humans
There exist two notable primary sources for how rarity is assigned to cards in the designing of the game. Rare, but well done from 2002 explores essentially why some rare cards aren’t good. It’s important to note here that the “mythic” rarity wasn’t added until 2008. The article explores why some rare cards simply were not “good.” The author, Mark Rosewater, the head designer of MTG since 2003; explains that confining cards to a rarity is often a challenge in R&D and sometimes uncommon cards are boosted into rare.
Often during design or development, one rarity gets overloaded. When this happens, R&D adjusts by forcing some of the variable cards up or down in rarity.
Another article, Quite the Rarity from 2018, more specifically addresses the impact and intention of rarity design. It goes through each rarity and the criteria that goes into each one such as complexity, wordiness, size of effect, and narrowness.
Some cards are very broad in their applications, while some cards are very narrow. The more niche you are as a card, the more you push toward the middle of rarity and away from the ends (common and mythic rare).
A fun idea that comes from this article is that it may be possible to determine rarity by the card art, (what Rosewater refers to as “appearance in the world”). Could a convolutional neural network (CNN) using image input to classify card rarity? We will be neither addressing nor answering this question here.
Based on these articles, rarity can be defined as a function of the card complexity and wordiness. From this, it should be possible to predict rarity by using card attributes as input to some model.
Data
Collection
There exist several accessible API’s and libraries for fetching MTG card data. Using one for Python, mtg-sdk-python, 43 expansion sets, from “2010 Core Set” to the latest (at time of writing) “Theros Beyond Death” are aggregated and preprocessed. Third-party API requests are rate limited to 5000 per hour but we should only have to fetch the sets once.
Preprocessing
Mana cost and attributes for a spell is processed into a 19 length vector.
‘type’, ‘C’, ‘R’, ‘U’, ‘B’, ‘G’, ‘W’, ‘X’,
‘B/G’, ‘B/R’, ‘G/U’, ‘G/W’, ‘R/G’, ‘R/W’, ‘U/B’,
‘U/R’, ‘W/B’, ‘W/U’, ‘legendary’
Type is codified by spell type (creature, sorcery, enchantment, etc.) Legendary is 1 or 0 if a card is tribal or legendary. The mana costs correspond to the amount of mana the card costs being zero if there is none.
Due to spell wording variance, the wording is normalized in such a way that their abilities are simpler to understand by a machine. What follows are descriptions of text processing and data-pruning that is performed for all cards. As spell abilities are of interest in this analysis, spells without abilities are not included, this simply leads to a lot of common creature cards not included in the dataset. For obvious reasons land type cards are left out of the data set too.
There is spell type “planeswalker,” until recently these were always mythic, and for good reason. These types of spells have abilities which when played increment or decrement a counter on the card, planeswalker abilities can only be played once per turn. Stronger planeswalkers often have a final ability which can be played after a few turns of increments, such final abilities are: “All creatures you control gain flying until one of turn” and even as strong as “if [condition] you win the game.” There are no common planeswalkers and thus they will be left out of analysis.
Also excluded from analysis are saga enchantments featured in the “Dominaria” expansion and the more recent “Theros Beyond Death” expansion. These cards are also never common. Furthermore, the structure of saga enchantments are longer than most spells and due to their scarcity are best left out of the dataset.
Split cards where two cards are printed on a single card are codified as two different cards in the dataset. They will be left like this and the label is the assigned rarity of the split card. This same separation is true for cards with adventures from the “Throne of Eldraine” expansion.
Some spells grant increased power and toughness to creatures, this comes in the permanent form of a “+1/+1 counter” or “+1/+1 until end of turn” effect. The sign on the “until end of turn” effects can be positive or negative, so can the number values. Where appropriate, the following combinations have been replaced in spell effects:
- +/+ : enhance
- -/- : weaken
- +/- : empower
- -/+ : toughen
Spells that create tokens (creatures created by abilities) are worded “create a 1/1 token”, in such a sentence the “1/1“ is removed. Some spells do create tokens with power and toughness greater than one so some information is being lost here. Mana symbols are replaced with their converted mana cost (cmc), the “tap” icon is replaced with the word “tap,” and other symbols such as punctuation and newlines are stripped out.
There are some cards which have been reprinted multiple times. They are usually cards with simple effects such as “Plummet,” “Act of Treason”, “Negate”. Keeping these duplicates is of benefit to the dataset because assigned rarities can vary from printing to printing the duplicates act as a form of natural data augmentation, which with the relatively small dataset we have, is valuable.
The data is balanced by type, so, despite the amount of sets and cards that are gathered (3670 common, 2886 uncommon, 2014 rare, and 491 mythic rare) we are limited by the amount of mythic rares (non-planeswalker, non-saga which is why the count is lower than other rarities). Using a 80/10/10 train/validation/test split leaves us with 1568 training examples, 196 validation and 196 test examples. (For those of you checking these numbers at home you will find that 491 * 0.8 * 4 = 1571, the calculation being done here is floor(491 * 0.8) * 4)). This is a comparatively small dataset for any learning method and one that we will have to keep in mind as we develop the models.
Naive models
To verify that this problem is addressable by learning based solutions we are going to start by examining simpler models that predict rarity. Full mana cost, card type, legendary status, and word count of card’s ability will be inputs to a variety of simple classification models from the SciKit-Learn Python library. Validation sets aren’t used in these modes, the train/test split is 80/20. Normalizing mana inputs between 0 and 1 does not improve model performance.
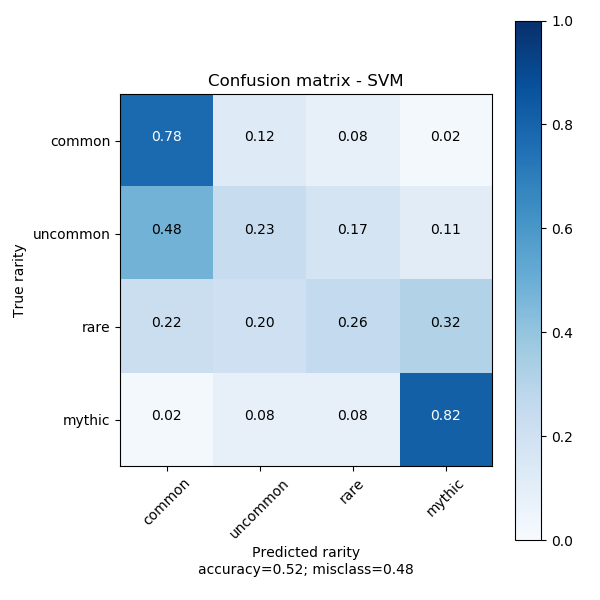
Linear SVM
clf = LinearSVC(max_iter=1000)
svm = CalibratedClassifierCV(clf)
svm.fit(train_values, train_labels)
This model explores the linearity of the data. As expected it does not perform well as the data is highly non-linear. However, it is indicative that there is some linear discriminant between common/uncommon and rare/mythic rare cards.
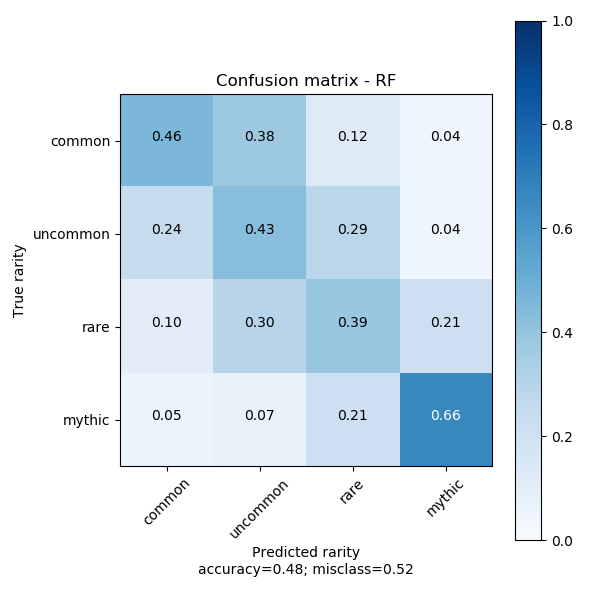
Random Forest
rf = RandomForestClassifier(
	n_estimators=500,
	random_state=123,
	class_weight={'common':0.1, 'uncommon':1, 'rare':1, 'mythic':0.1}
)
rf.fit(train_values, train_labels)
This model might be closest to how a human might quickly determine card rarity, that is by looking at the mana cost and the size of the text. Could a decision tree replicate this process? The answer is somewhat yes, rather well too. The confusion matrix has a modest diagonal that could certainly be improved. This diagonal shape in confusion matrices is exemplary of a good model in this application. We trust that the designers of the cards do not misclassify a card by more than one rarity in either direction.
MLP
mlp = MLPClassifier(
	solver='adam',
	activation='relu',
	hidden_layer_sizes=(64,64,64,64),
	max_iter=5000,
	random_state=123
)
mlp.fit(train_values, train_labels)
This model is a small neural network of four fully connected layers of 64 neurons using the ReLU activation function. It performs the best out of the naive models, there is the same “smudging” around predictions that we saw in the random forest model.
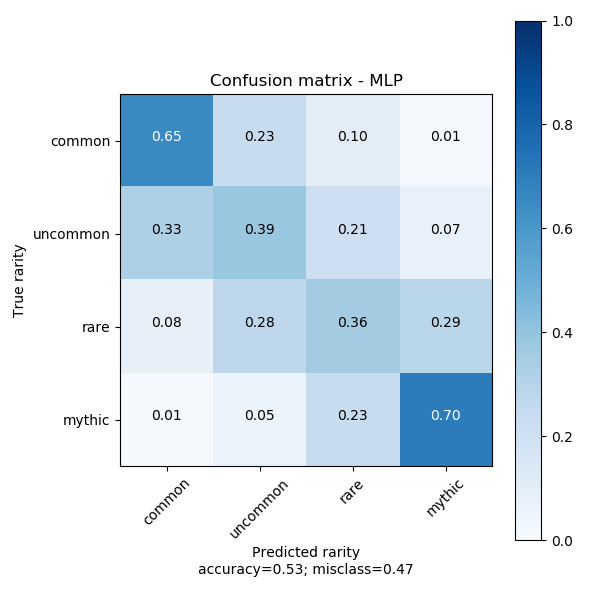
Based on average precision of the three models the performance of the MLP classifier is indicative that an approach involving a neural network is the correct one. The MLP model will be adapted as the “cost” pipeline in the larger holistic model.
Holistic machine learning model
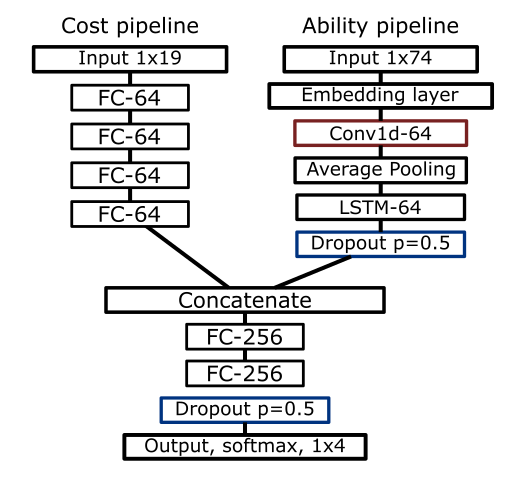
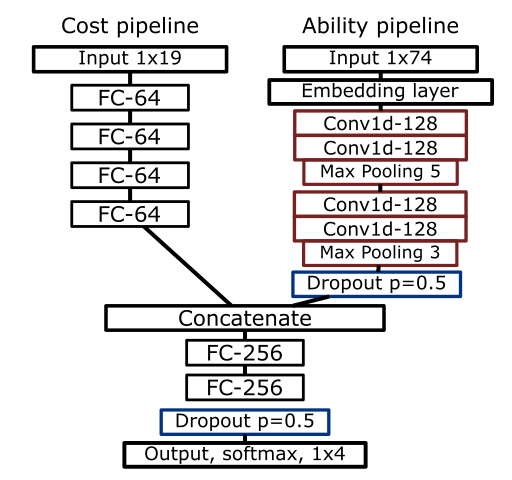
With a model sufficiently predicting rarity with basic numeric inputs, a pipeline predicting rarity with card ability is devised. Using the Keras functional API with the TensorFlow backend this and the cost pipeline can be combined to create a holistic model which takes mana cost, type, legendary status, and ability text as input. There are two variants of the ability pipeline: an LSTM and a CNN variant.
Word embedding and tokenization
Two word embeddings were used for comparison. A Word2Vec embedding was created from the corpus of ability text, three embeddings were made of sizes 100, 200, and 300. The standard pretrained GloVe embeddings of size 100, 200, and 300 were also used. Keras text preprocessor was used for word tokenization.
Architectures
The LSTM variant takes the tokenized input from the card ability and puts it through the word embedding. This gets processed with a 1D convolutional layer, average pools the output, and and feeds the result through an LSTM layer of 128 units. There is a dropout layer with a dropout percentage of 50%. The output from the dropout layer is concatenated with the output from the mana-cost pipeline. The parameters are then fed through two fully connected layers of 256 units with the ReLU activation function. This is followed by a dropout layer with probability of 0.5. The output layer is of size four neurons employing the softmax activation function. A diagram of this model is below.
In the CNN variant, after the embedding layer there are two 1D convolutional layers with 128 filters, a kernel size of 3, and using the ReLu activation function. A 1D max-pooling layer of size 5 follows this. Another two 1D convolutional layers with the same parameters as the first two follow. The end of this is a 1D max-pooling layer of size 3. Followed by the dropout layer and then the concatenate layer which feeds the same two fully connected layers of size 256 as above.
The Adam optimizer was used with a maximum of 50 epochs with a batch size of 48. The model is sensitive to batch sizes, 32 was found to be too low, but 64 was too high. Early stopping stopping was employed with a patience of 4. Both variants of each model was run three times on each size of each word embedding. Best performing models of each variant in terms of precision are examined below.
Results
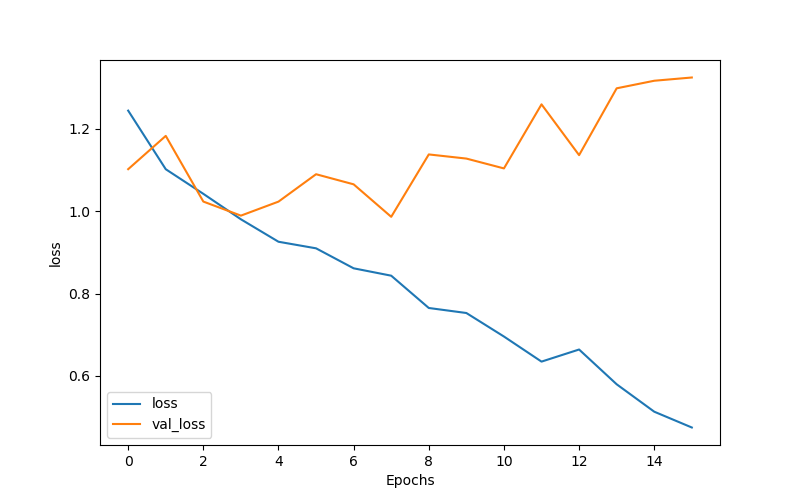
With early stopping, models rarely made it into the mid-teen epochs. The training curves of the LSTM and CNN variant exhibit an overfit pattern. Normally this is not a good thing, one would want their models to be robust so that data not seen by the network can be classified. Here, because we are looking for definite rarity outliers we want model accuracy to be as high as possible, so it doesn’t matter much if the models are overfit. A training curve for the best performing LSTM variant is below:
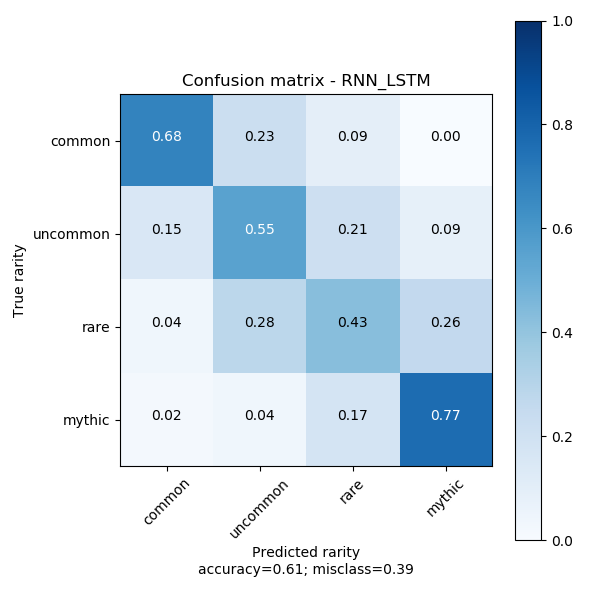
Regarding accuracy, the CNN variant has difficulty attaining an accuracy over 50% using either word embedding—glove or word2vec. Similarly, the LSTM variant cannot surpass 50% accuracy using the word2vec embedding also. In a demonstration of the importance of pre-trained embeddings the LSTM variant with any size of the Glove embeddings (100, 200, 300) regularly surpasses 55% accuracy. The best of these models using these embeddings is uses the 200 length embedding to attain an accuracy of 61% with a loss of 1.24. Its confusion matrix is below:
As mentioned above the CNN variant rarely passes 50% accuracy and gets poor precision. What is of interest is that its accuracy is best with the Word2Vec embeddings of size 100. Unfortunately this does not imply good precision which is what we’re looking for. Its confusion matrix exhibits a split similar to that of the naive SVM model above, that is, it seems the be splitting the data in a more linear fashion than we would like. 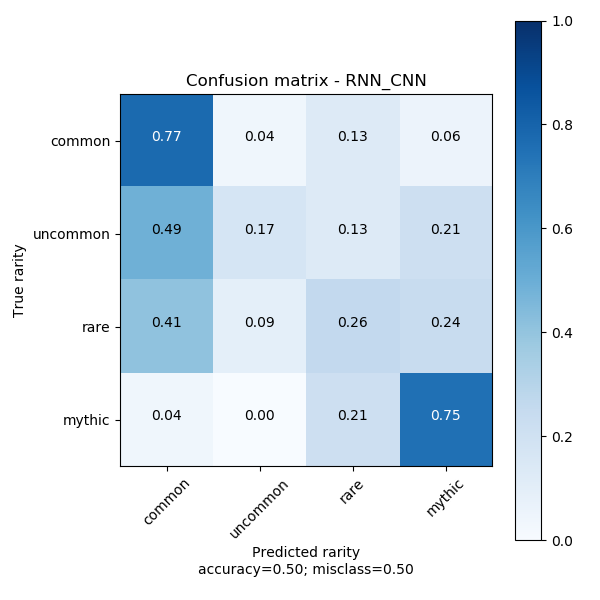
Because the CNN variant cannot achieve good precision the rest of this article will focus on the results from the best LSTM variant.
Discussion
Finding the outliers
With the predictions of a set the predictions can be visualized and explored in a web browser. Using a Jinja2 template all the cards can be laid out in a webpage. With some dataset tags and JavaScript the cards can be filtered by set and, optionally, by if they are misclassified or not. Card images are lazy loaded so as to not load hundreds of images at once.
Some misclassifications by distance
From visual inspection of the latest sets that are in standard rotation (GRN, RNA, WAR, M20, ELD, THB) the model seems to bias upwards rather than downwards. This is also noticeable in the confusion matrix. What follows is some highlights of cards that are misclassified by some distance. We define distance as how many rarities above or below its actual rarity the model misclassifies a card. For example an uncommon to mythic is a distance of 2. The full page for this inspection is hosted here: thesixsides.com/misc/model-analysis.html
Distance of 1:
Because the model baises upwards and the abundance of common cards there are a lot of commons that the model predicts are uncommon. Misclassifications of this distance are the most plausible but there are definitely wrong ones too.
- Wilderness Reclamation (RNA): This is an uncommon that the model predicts is a rare with a confidence of 70.8% and mythic rare with 20.9%. I agree with this misclassification, this card grants twice the amount of mana and saves someone from tapping out.
- Witch’s Vengeance (WAR): This is a rare the model predicts is uncommon with a confidence of 82.6%. This is a good example of a card with a narrow effect (-3/-3 for certain creature types) as well as the model failing to understand what the card effect does in the context of the game. This could also be an example where our ability normalization removing too much information, the -3/-3 is replaced with simply “weaken.”
Distance of 2: Many more uncommons are classified as mythics than vice versa. An exception is with cards from the Throne of Eldraine set (ELD), adventure cards in this set are sometimes classified both ways, but usually downwards.
- Deafening Clarion (GRN): This is a rare card the model thinks is common with a confidence of 69.8% and 29.9% that it is common. This is similar to the prediction of the card above “Witche’s Vengence” the model fails to truly understand the playability of this card and its context in the game.
- Anax, Hardened in the Forge (THB): This is an uncommon that the model predicts as mythic with a confidence of 96.7% and I might agree with this. Its power is equal to the players devotion to red and when it or another creature dies it creates a 1/1 token creature that can only attack.
Distance of 3: As mentioned previously an aim of the model design was to avoid misclassifications with a distance of 3. Nevertheless the model does detect some and it reveals a bit about what attributes or phrases it may be assigning too much weight too. No mythic rare cards are classified as common, of the examined sets seven common spells are classified as mythic.
- Celesital Messenger (M20): This card’s effect is narrow yet the model predicts that this card should be of the utmost rarity. The flash and flying attributes along with the mana cost might be overweighing this. The model is 48.2% confident that it is mythic and 46.3% confident that it is rare.
- Darkblade Agent (GRN): The fact that this card gets deathtouch and “draw a card when it deals combat damage” makes it very versatile and I would personally think this is an uncommon, slightly maybe a rare, likely not a mythic. Its mana cost is very low too making it a good card to play early. The model is 92.1% confident that it is mythic.
Conclusion
The model accuracy is better than random and visual examination partially confirms results from the LSTM variant. Based on this, it is definitely possible to classify cards using learning-based techniques. It is yet to be determined how well they can be exploited as it varies on player ability to interpret the card. It may be more viable to think of these cards as hints rather than firm advice that some card is over- or under-weighted when it comes to rarity.
Further Work
The problem of limited data is definitely glaring and immediately prevents us from making more sure conclusions about the accuracy and usefulness of the models. The data limitations also prevent us from using more complex network units such as attention or larger NLP models such as BERT or GPT–2. Using the pertained versions of those models may yield some satisfactory results, mana-cost is important in judging a card and so that pipeline has to be integrated somehow.
Rarity is not the end-all determination of a card, it is how the card is used. DraftSim.com lists rankings of cards by utility in the draft style of play. Using the rankings of cards from DraftSim other networks, perhaps of a similar architecture as here, could be trained to determine card utility in a draft setting. Similar network architectures could be applied to other major collectible card games such as Hearthstone, Gwent, or Legends of Runeterra.
All code can be viewed and downloaded at github.com/tristaaan/magic-rarity-predict. The models and datasets are small enough that they can be trained on a 2015 laptop in a few minutes.
Thanks for Sean G. for helping me with some of the intricacies and edge cases of MTG as well as explaining to me the value of some of the cards themselves.
Thanks for reading!